STA 326 2.0 Programming and Data Analysis with R
🌍 Data Import and Export
Dr Thiyanga Talagala
Today's menu
- Data import
- Data export

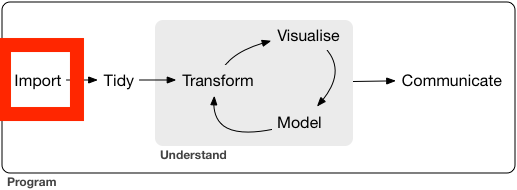
Data Science Workflow: Import

Data import with readr
readr: part of the core tidyverse.
library(tidyverse)Data import with readr
readr: part of the core tidyverse.
library(tidyverse)readr data import functions
read_csv: reads comma-delimited files.read_csv2: reads semicolon-separated filesread_tsv: reads tab-delimited files
🛠 Import data from a .csv file (local machine)
Syntax
datasetname <- read_csv("include_file_path")When you run read_csv, it prints out the names and type of each column.
Switch to R
If the file is saved inside the project folder: part 1
If the file is saved outside the project folder: part 2
🛠 Importing csv file from a website
Syntax
datasetname <- read_csv("include url here")Example
url <- "https://thiyanga.netlify.app/project/datasets/foodlabel.csv"foodlabel <- read_csv(url)head(foodlabel, 1)# A tibble: 1 x 80 Gender Age Education Employment Income Housesize children marital fshopper <dbl> <dbl> <dbl> <dbl> <dbl> <dbl> <dbl> <dbl> <dbl>1 1 22 5 4 3 5 2 0 0# … with 71 more variables: mplanner <dbl>, place <dbl>, FA <dbl>,# Diabetes <dbl>, Metabolic cyndrents <dbl>, Other <dbl>, specific <dbl>,# job1 <dbl>, job2 <dbl>, Exercise <dbl>, Health <dbl>, taste <dbl>,# easy <dbl>, familiarity <dbl>, friends <dbl>, Useful <dbl>, Easiness <dbl>,# Sufficient <dbl>, Trusfulness <dbl>, Clear <dbl>, attractive pack <dbl>,# hc/nutriclaims <dbl>, graphical <dbl>, Free/prize <dbl>, source <dbl>,# netquan <dbl>, low in fat <dbl>, low in cho <dbl>, sodium <dbl>,# e labels <dbl>, place2 <dbl>, fa2 <dbl>, Health_1 <dbl>, X43 <dbl>,# f1 <dbl>, f2 <dbl>, f3 <dbl>, f4 <dbl>, f5 <dbl>, f6 <dbl>, f7 <dbl>,# f8 <dbl>, f9 <dbl>, f10 <dbl>, f11 <dbl>, f12 <dbl>, f13 <dbl>, f14 <dbl>,# f15 <dbl>, f16 <dbl>, f17 <dbl>, f18 <dbl>, i1 <dbl>, i2 <dbl>, i3 <dbl>,# i4 <dbl>, i5 <dbl>, i6 <dbl>, i7 <dbl>, i8 <dbl>, i9 <dbl>, i10 <dbl>,# i11 <dbl>, i12 <dbl>, i13 <dbl>, i14 <dbl>, i15 <dbl>, i16 <dbl>,# i17 <dbl>, i18 <dbl>, cluster <dbl>read.csv and read_csv
read.csvis in base R.read_csvis in tidyverse.read.csv()performs a similar job toread_csv().read_csv()works well with other parts of the tidyverse.read_csv()is faster thanread.csv().read_csv()will always read variables containing text as character variable. In contrast, the base R functionread.csv()will, by default, convert any character variable to a factor.
🛠 Writing data to a .csv file
We can save tibble (or dataframe) to a csv file, using
write_csv().write_csv()is in thereadrpackage.
Syntax
write_csv(name_of_the_data_set_you_want_to_save, "path_to_write_to")Example
data(iris)# This will save inside your project folderwrite_csv(iris, "iris.csv") # This will save inside the data folder which is inside your project folderwrite_csv(iris, "data/iris.csv")Swtich to R
🛠 Importing data from .xlsx files
Syntax
library(readxl)mydata <- read_xlsx("file_path")Switch to R
Importing SAS, SPSS and STATA files
SAS
read_sas("mtcars.sas7bdat")write_sas(mtcars, "mtcars.sas7bdat")SPSS
read_sav("mtcars.sav")write_sav(mtcars, "mtcars.sav")Stata
read_dta("mtcars.dta")write_dta(mtcars, "mtcars.dta")Importing other types of data
feather: for sharing with Python and other languageshttr: for web apisjsonlite: for JSONrvest: for web scrapingxml2: for XML
Working with feather, httr, jsonlite, rvest and xml2 is beyond the scope of the course.