STA 326 2.0 Programming and Data Analysis with R
The Grammar of Graphics
Dr Thiyanga Talagala
Online distance learning/teaching materials during the COVID-19 outbreak.

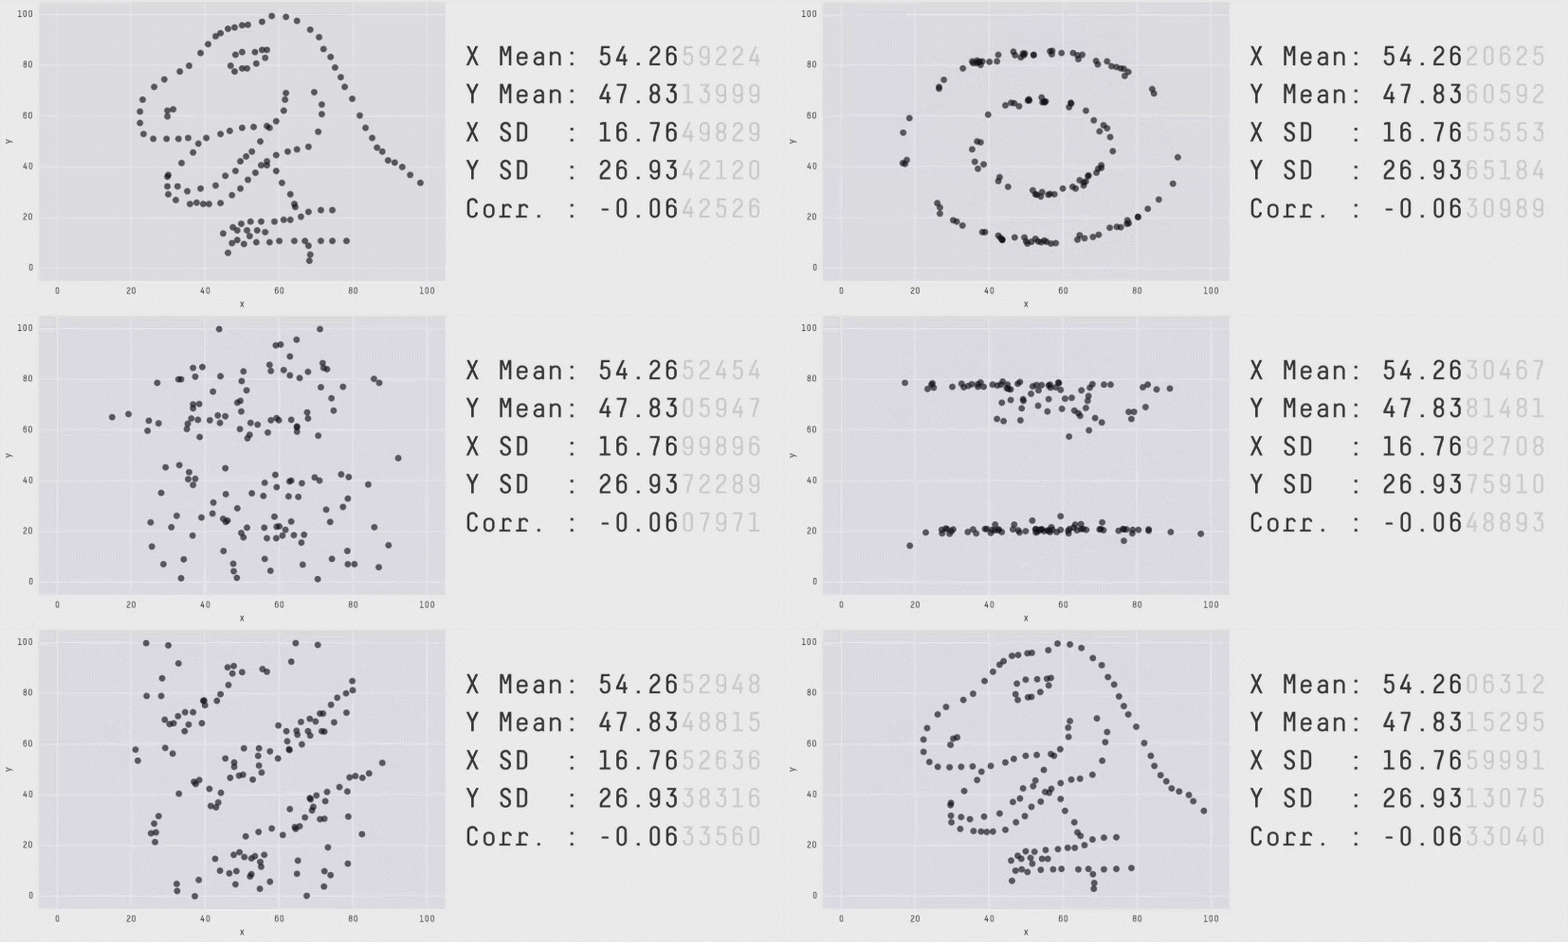
Acknowledgement: Justin Matejke and George Fitzmaurice, Autodesk Research, Canada
Grammar of Graphics


Packages
library(tidyverse) # To obtain ggplot2library(magrittr)

Dataset
library(gapminder)glimpse(gapminder)Rows: 1,704Columns: 6$ country <fct> Afghanistan, Afghanistan, Afghanistan, Afghanistan, Afghani…$ continent <fct> Asia, Asia, Asia, Asia, Asia, Asia, Asia, Asia, Asia, Asia,…$ year <int> 1952, 1957, 1962, 1967, 1972, 1977, 1982, 1987, 1992, 1997,…$ lifeExp <dbl> 28.801, 30.332, 31.997, 34.020, 36.088, 38.438, 39.854, 40.…$ pop <int> 8425333, 9240934, 10267083, 11537966, 13079460, 14880372, 1…$ gdpPercap <dbl> 779.4453, 820.8530, 853.1007, 836.1971, 739.9811, 786.1134,…Plotting with R
Base R
- using
plot()function
Using ggplot2: grammar of graphics
ggplot2 package:
qplot()functionqplot: quick plot
very similar to how you graph with
plot()function
ggplot2 package:
ggplot()function- fully utilize the power of grammar
Grammar
English
Nouns
Article
Adjective
Verb
Adverb
Proposition
Graphics
Grammar
English
The little monkey hangs confidently by a branch.
Article: The
Adjective: little
Noun: monkey
Verb: hangs
Adverb: Confidently
Proposition: by
Noun: a branch
Graphics
ggplot(iris)+ aes(x = Sepal.Length, y = Sepal.Width)+ geom_point()
Elements of ggplot2 object
Data
Aesthetics:
x,y,colGeometrics:
geom_point,geom_boxplot
Elements of ggplot2 object
Data:
dataAesthetics:
aesGeometrics:
geom_*
Making your first plot with ggplot
Data: data to be plotted
'data.frame': 150 obs. of 5 variables: $ Sepal.Length: num 5.1 4.9 4.7 4.6 5 5.4 4.6 5 4.4 4.9 ... $ Sepal.Width : num 3.5 3 3.2 3.1 3.6 3.9 3.4 3.4 2.9 3.1 ... $ Petal.Length: num 1.4 1.4 1.3 1.5 1.4 1.7 1.4 1.5 1.4 1.5 ... $ Petal.Width : num 0.2 0.2 0.2 0.2 0.2 0.4 0.3 0.2 0.2 0.1 ... $ Species : Factor w/ 3 levels "setosa","versicolor",..: 1 1 1 1 1 1 1 1 1 1 ...Data
ggplot(iris)
Aesthetics: mapping variables
x
y
colour
shape
Data + Aesthetics
ggplot(iris,aes(x =S epal.Length, y = Sepal.Width))
Geometrics
geom_point
geom_boxplot
Data + Aesthetics + Geometrics
ggplot(iris,aes(x = Sepal.Length, y = Sepal.Width))+ geom_point()
Data + Aesthetics + Geometrics
ggplot(iris,aes(x = Sepal.Length, y = Sepal.Width))+ geom_point()
Data + Aesthetics + Geometrics
ggplot(iris,aes(x = Sepal.Length, y = Sepal.Width))+ geom_point(col = "forestgreen")
Data + Aesthetics + Geometrics
ggplot(iris,aes(x = Sepal.Length, y = Sepal.Width))+ geom_point(col = "forestgreen", shape = 8)
Data + Aesthetics + Geometrics
ggplot(iris,aes(x = Sepal.Length, y = Sepal.Width, col = Species))+ geom_point()
Data + Aesthetics + Geometrics
ggplot(iris,aes(x = Sepal.Length, y = Sepal.Width, col= Species))+ geom_point( shape = 3 )
Data + Aesthetics + Geometrics
ggplot(iris,aes(x = Sepal.Length, y = Sepal.Width, col = Species))+ geom_point()
Facets: small multiples
Data + Aesthetics + Geometrics + Facets
ggplot(iris,aes(x = Sepal.Length, y = Sepal.Width, col = Species))+ geom_point()+ facet_grid(~Species)
Data + Aesthetics + Geometrics + Facets
ggplot(iris,aes(x = Sepal.Length, y = Sepal.Width, col = Species))+ geom_point()+ facet_grid(Species ~.)
Statistics
Data + Aesthetics + Geometrics + Facets + Statistics
ggplot(iris,aes(x = Sepal.Length, y = Sepal.Width, col = Species))+ geom_point()+ facet_wrap(~Species)+ stat_smooth(method = "lm", se = F, col ="red")
Data + Aesthetics + Geometrics + Facets + Statistics
ggplot(iris,aes(x = Sepal.Length, y = Sepal.Width, col = Species))+ geom_point()+ facet_wrap( ~ Species)+ stat_smooth(method = "lm", se = T, col = "red")
Coordinate
Data + Aesthetics + Geometrics + Facets + Statistics + Coordinate
ggplot(iris,aes(x = Sepal.Length, y = Sepal.Width, col = Species)) + geom_point() + facet_wrap( ~ Species) + stat_smooth(method = "lm", se = T, col = "red") + coord_equal()
Theme
Data + Aesthetics + Geometrics + Facets + Statistics + Coordinate+ Theme
ggplot(iris,aes(x = Sepal.Length, y = Sepal.Width, col = Species)) + geom_point() + facet_wrap( ~ Species) + stat_smooth(method = "lm", se = T, col ="red") + coord_equal() + theme(legend.position = "bottom")
Scale
Data + Aesthetics + Geometrics + Facets + Statistics + Coordinate + Theme + Scale
ggplot(iris,aes(x = Sepal.Length, y = Sepal.Width, col = Species)) + geom_point() + facet_wrap( ~ Species) + stat_smooth(method = "lm", se = T, col = "red") + coord_equal() + theme(legend.position = "bottom") + scale_color_manual(values = c("#1b9e77", "#d95f02", "#7570b3"))
titles and axes labels
ggplot(iris,aes(x = Sepal.Length, y = Sepal.Width, col = Species)) + geom_point() + facet_wrap( ~ Species) + stat_smooth(method = "lm", se = T, col = "red") + coord_equal() + theme(legend.position = "bottom") + scale_color_manual(values = c("#1b9e77", "#d95f02", "#7570b3"))+labs(title="Scatter plot of Sepal Length vs Sepal Width", x ="Sepal Length (cm)", y = "Sepal Width (cm)")
Your turn
Dataset: gapminder
Visualize the relationship between life expectancy, GDP per capita and continent in 2007.
gapminder2007 <- gapminder %>% filter(year == 2007)ggplot(gapminder2007,aes(x = lifeExp, y = gdpPercap, col=continent)) + geom_point() + theme(legend.position = "bottom") + labs(title = "Relationship between life expectancy and GPD per capita by continent - 2007", x ="life expectancy at birth, in years", y = "GDP per capita (US$, inflation-adjusted)")
Add a vertical line
gapminder2007 <- gapminder %>% filter(year == 2007)ggplot(gapminder2007,aes(x = lifeExp, y = gdpPercap, col=continent)) + geom_point() + geom_vline(xintercept = 70)
Add a horizontal line
gapminder2007 <- gapminder %>% filter(year == 2007)ggplot(gapminder2007,aes(x = lifeExp, y = gdpPercap, col=continent)) + geom_point() + geom_hline(yintercept = 20000)
Add a diagonal line
gapminder2007 <- gapminder %>% filter(year == 2007)ggplot(gapminder2007,aes(x = lifeExp, y = gdpPercap, col=continent)) + geom_point() + geom_abline(intercept = 20, slope=200)
All Geoms
[1] "geom_abline" "geom_area" "geom_bar" [4] "geom_bin2d" "geom_blank" "geom_boxplot" [7] "geom_col" "geom_contour" "geom_contour_filled"[10] "geom_count" "geom_crossbar" "geom_curve" [13] "geom_density" "geom_density_2d" "geom_density2d" [16] "geom_dotplot" "geom_errorbar" "geom_errorbarh" [19] "geom_freqpoly" "geom_hex" "geom_histogram" [22] "geom_hline" "geom_jitter" "geom_label" [25] "geom_line" "geom_linerange" "geom_map" [28] "geom_path" "geom_point" "geom_pointrange" [31] "geom_polygon" "geom_qq" "geom_qq_line" [34] "geom_quantile" "geom_raster" "geom_rect" [37] "geom_ribbon" "geom_rug" "geom_segment" [40] "geom_sf" "geom_sf_label" "geom_sf_text" [43] "geom_smooth" "geom_spoke" "geom_step" [46] "geom_text" "geom_tile" "geom_violin" [49] "geom_vline"geom_boxplot
ggplot(gapminder2007, aes(x=lifeExp, y=continent)) +geom_boxplot()
geom_boxplot
ggplot(gapminder2007, aes(x=lifeExp, y=continent, color=continent)) +geom_boxplot()
geom_boxplot
ggplot(gapminder2007, aes(x=lifeExp, y=continent, fill=continent)) +geom_boxplot()
geom_boxplot
ggplot(gapminder2007, aes(x=lifeExp, y=continent)) +geom_boxplot(fill="forestgreen")
geom_boxplot
ggplot(gapminder2007, aes(x=lifeExp, y=continent)) +geom_boxplot(fill="forestgreen", alpha=0.5)
geom_point
ggplot(gapminder2007, aes(x=lifeExp, y=continent)) + geom_point()
geom_jitter
ggplot(gapminder2007, aes(x=lifeExp, y=continent)) + geom_jitter()
geom_jitter + geom_boxplot
ggplot(gapminder2007, aes(x=lifeExp, y=continent)) + geom_jitter() + geom_boxplot()
geom_jitter + geom_boxplot
ggplot(gapminder2007, aes(x=lifeExp, y=continent)) + geom_jitter() + geom_boxplot(alpha=0.5)
geom_jitter + geom_boxplot
ggplot(gapminder2007, aes(x=lifeExp, y=continent)) + geom_boxplot() + geom_jitter()
geom_jitter + geom_boxplot
ggplot(gapminder2007, aes(x=lifeExp, y=continent, fill=continent)) + geom_boxplot() + geom_jitter()
geom_jitter + geom_boxplot
ggplot(gapminder2007, aes(x=lifeExp, y=continent, fill=continent)) + geom_boxplot() + geom_jitter(aes(col=continent))
geom_jitter + geom_boxplot (outlier.shape = NA)
ggplot(gapminder2007, aes(x = lifeExp, y = continent, fill = continent)) + geom_boxplot(outlier.shape = NA) + geom_jitter(aes(col = continent))
geom_jitter + geom_boxplot
ggplot(gapminder2007, aes(x=lifeExp, y=continent, fill=continent, col=continent))+ geom_boxplot(outlier.shape = NA) + geom_jitter(aes(col=continent))
geom_jitter + geom_boxplot
ggplot(gapminder2007, aes(x=lifeExp, y=continent, fill=continent, col=continent))+ geom_boxplot(outlier.shape = NA, alpha=0.2) + geom_jitter(aes(col=continent))
geom_jitter + geom_boxplot + coord_flip
ggplot(gapminder2007, aes(x=lifeExp, y=continent, fill=continent, col=continent))+ geom_boxplot(outlier.shape = NA, alpha=0.2) + geom_jitter(aes(col=continent)) + coord_flip()
geom_boxplot
ggplot(gapminder2007, aes(y=lifeExp))+ geom_boxplot()
geom_boxplot + facet_wrap
ggplot(gapminder2007, aes(y = lifeExp))+ geom_boxplot() + facet_wrap(~continent, ncol = 5)
geom_density
ggplot(gapminder2007, aes(x=lifeExp))+ geom_density() + facet_wrap(~continent, ncol=5)
Your turn
Modify the code below to obtain the following plot.
ggplot(gapminder2007, aes(x=lifeExp))+ geom_density()
geom_histogram
ggplot(gapminder2007, aes(x=lifeExp))+ geom_histogram()
geom_bar
ggplot(gapminder2007, aes(x=continent))+ geom_bar()
Your turn
Modify the code below to obtain the following plot.
ggplot(gapminder2007, aes(x=continent))+ geom_bar()
geom_bar (stat="identity")
Method 1
cut.percent <- data.frame(cut=c("Fair", "Good", "Very Good", "Premium", "Ideal"), percent=c(3, 9, 22.4, 25.6, 40))cut.percent cut percent1 Fair 3.02 Good 9.03 Very Good 22.44 Premium 25.65 Ideal 40.0ggplot(data=cut.percent, aes(x=cut, y=percent)) + geom_bar(stat="identity")
geom_col
Method 2
cut.percent <- data.frame(cut=c("Fair", "Good", "Very Good", "Premium", "Ideal"), percent=c(3, 9, 22.4, 25.6, 40))cut.percent cut percent1 Fair 3.02 Good 9.03 Very Good 22.44 Premium 25.65 Ideal 40.0ggplot(data=cut.percent, aes(x=cut, y=percent)) + geom_col()
Change the order of levels
Method 2
cut.percent <- data.frame(cut=c("Fair", "Good", "Very Good", "Premium", "Ideal"), percent=c(3, 9, 22.4, 25.6, 40))cut.percent$cut <- factor(cut.percent$cut, levels = c("Fair", "Good", "Very Good", "Premium", "Ideal"))ggplot(data=cut.percent, aes(x=cut, y=percent)) + geom_col()
geom_point
gapminder %>%filter(country == "India") %>%ggplot(aes(x = year, y = gdpPercap)) +geom_point()
geom_line
gapminder %>%filter(country == "India") %>%ggplot(aes(x = year, y = gdpPercap)) +geom_line()
geom_line + geom_point
gapminder %>%filter(country == "India") %>%ggplot(aes(x = year, y = gdpPercap)) +geom_line() + geom_point()
Your turn
Modify the code below to obtain the following plot.
gapminder %>% filter(country == "India") %>%ggplot(aes(x = year, y = gdpPercap)) + geom_line() + geom_point()
Data Wrangling + Data Visualization
avglifeExp <- gapminder %>% group_by(continent, year) %>% summarise(meanlifeExp=mean(lifeExp))avglifeExp# A tibble: 60 x 3# Groups: continent [5] continent year meanlifeExp <fct> <int> <dbl> 1 Africa 1952 39.1 2 Africa 1957 41.3 3 Africa 1962 43.3 4 Africa 1967 45.3 5 Africa 1972 47.5 6 Africa 1977 49.6 7 Africa 1982 51.6 8 Africa 1987 53.3 9 Africa 1992 53.610 Africa 1997 53.6# … with 50 more rowsYour turn
Write an R code to reproduce the plot below.
Hint: use avglifeExp

Your turn
Write an R code to reproduce the plot below.

Your turn
Write an R code to reproduce the plot below.

Hint: Next slide
gapminder %>% ggplot(aes(y=log(lifeExp), x=log(gdpPercap), color=continent)) + geom_point() + labs(y = "log(Life Expectancy)", x = "log(GDP per capita)")
Your turn
Write an R code to reproduce the plot below.

geom_point
ggplot(gapminder, aes(x=year, y=gdpPercap, colour=continent))+geom_point()
geom_smooth
ggplot(gapminder, aes(x=year, y=gdpPercap, colour=continent))+geom_smooth()
Your turn
Write an R code to reproduce the plot below.

Your turn
Write an R code to reproduce the plot below.

Your turn
Write an R code to visualize the shape of standard normal distribution.
Hint: dnorm

Recap
aes
- x
- y
- colour
- size
geom
- geom_point
- geom_jitter
- geom_line
- geom_bar
- geom_col
- geom_histogram
- geom_smooth
- geom_density
- geom_abline
- geom_vline
- geom_hline
geom arguments
- colour
- fill
- size
- alpha
- shape
other elements
- labs
- coord_equal
- coord_flip
- scale_colour_manual
- labs
- facet_wrap
- theme