Coronavirus Situation In China
Dilni T Ekanayake
7/18/2020
Introduction
[World map of Wuhan,China] (https://www.worldmap1.com/map/china/wuhan/map%20of%20wuhan%20world.jpg)
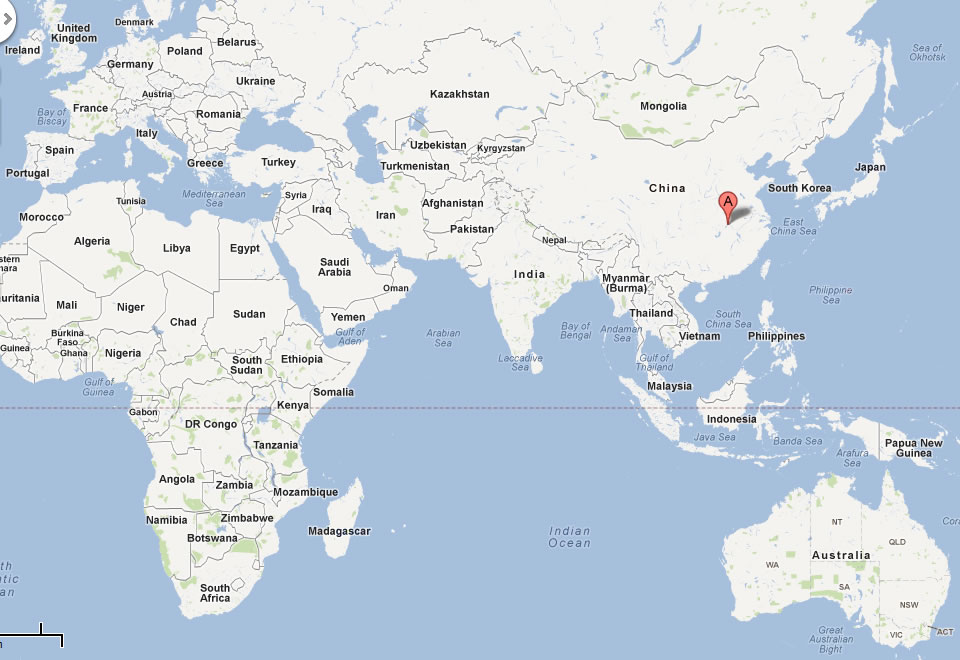
“A study in Korea found that the risk of influenza incidence was significantly increased with low daily temperature and low relative humidity, a positive significant association was observed for diurnal temperature range (DTR) (Park et al., 2019)”. Wuhan is located in Hubei Province and one of the largest cities in Central China. Due to the location of the Yangtze River Delta, Wuhan has a typical subtropical, humid, monsoon climate with cold winters and warm summers and the average annual temperature and rainfall are 15.8 °C–17.5 °C and 1050 mm–2000 mm, respectively, [4] Yueling Ma (1 July 2020).When we talk about China, because it covers a large area, it is the country with the biggest climate change per single country. Northern China, January is the coldest month of the year and Southern China has a monsoon season. The Southern China is prone to typhoons from May to December, but especially July to September and West China has the most extreme summer to winter temperature differences and the average minimum temperature in January is -11°C. Most of China is very hot in July and August. Many studies reported that the COVID-19 was related to the meteorological factors, which decreased with the temperature increasing, but their effects on the mortality have not been reported. Therefore, we assume that the weather conditions might also contributed to the mortality of COVID-19.
Thus, due to natural causes or other reasons, as the spread of the virus increased, the Chinese government decided to close some cities and countries. China was the first country to put a lockdown into effect in a bid to curb the spread of coronavirus across the nation. The world was stunned by the country’s decision, but after two months of lockdown measures, the country has seen a huge reduction in cases. As first put Wuhan City on lockdown on January 23 and Chinese authorities meant no travel in or out of the city was allowed, even for those who had important medical or humanitarian reasons. “When the lockdown first began people were allowed out of their homes, but restrictions soon tightened. In some areas, this was limited to outings of just one member of a family every two days in order to buy necessities. Others barred residents from leaving, obligating them to order food and other supplies from couriers. When the policy later stepped up again, officials visited homes door to door to undertake health checks and force ill persons into isolation.” Then China started to relax some measures after 59 days the lockdown was first introduced and the government has ordered travellers from abroad to isolate themselves for 14 days at their homes or at government-designated centers as part of a quarantine process, [1] Kaisha Langton (30 May 2020).
Other than lockdown, Chinese government launched a series of emergency measures to respond to the challenges of the epidemic. Accordingly setup headquarters for the COVID-19 pneumonia epidemic, all of the Provinces in Mainland China launched public health emergencies response and to encourage patients to see doctor in time, the Chinese government announced that the medical expenses for the COVID-19 Pneumonia would be mainly borne by the medical insurance and government. Also decided to construct two makeshift hospital within 15 days and supported to all researchers, Pharmaceutical companies for their research. Furthermore government was authorized to mobilize and expropriate all kinds of personnel, materials, transportation and related facilities to block the epidemic area, to restrict or stop the market, assembly, theater performance and other group gathering activities, to declare the suspension of work, business and class [3] Yu X (29 May 2020).
The virus is now spreading all over the world. “COVID-19 is a serious illness, and it’s much more dangerous than the flu. One Centers for Disease Control and Prevention (CDC) projection suggests that between 160 to 214 million people will eventually be infected in the US and that between 200,000 and 1.7 million could die.” [2] Nicole Wetsman (7 July 2020). Therefore everyone should know about the virus and protection methods. The symptoms of COVID-19 have ranged from mild, like those in a cold, to severe. Sometimes don’t require hospitalization, but cases are critical and can be die. The virus moves rapidly, “It also probably spreads when an infected person sneezes or coughs. Coughs and sneezes produce little droplets of mucus and saliva. If these droplets make it into another person’s eyes, mouth, or nose, they can get sick. The viruses in those little droplets can also fall onto surfaces, like tables or doorknobs — if someone touches that surface and touches their eyes, mouth, or nose, they can also get sick.” The dangerous side, there aren’t any proven treatments for COVID-19. Therefore it is important to protect ourselves and others. For that stay home as much as possible even if you’re not feeling sick, wear a cloth mask or face covering when you’re out in public, and wash your hands often, [2] Nicole Wetsman (7 July 2020).Data Analysis and Results
Data
data(coronavirus)
head(coronavirus)| date | province | country | lat | long | type | cases |
|---|---|---|---|---|---|---|
| 2020-01-22 | Afghanistan | 33 | 65 | confirmed | 0 | |
| 2020-01-23 | Afghanistan | 33 | 65 | confirmed | 0 | |
| 2020-01-24 | Afghanistan | 33 | 65 | confirmed | 0 | |
| 2020-01-25 | Afghanistan | 33 | 65 | confirmed | 0 | |
| 2020-01-26 | Afghanistan | 33 | 65 | confirmed | 0 | |
| 2020-01-27 | Afghanistan | 33 | 65 | confirmed | 0 |
- For futher analysis this coronavirus data set was used.
##       date              province           country               lat
##  Min.   :2020-01-22   Length:87695       Length:87695       Min.   :-51.796
##  1st Qu.:2020-02-18   Class :character   Class :character   1st Qu.:  6.611
##  Median :2020-03-17   Mode  :character   Mode  :character   Median : 22.300
##  Mean   :2020-03-17                                         Mean   : 20.848
##  3rd Qu.:2020-04-14                                         3rd Qu.: 40.143
##  Max.   :2020-05-12                                         Max.   : 71.707
##       long             type               cases
##  Min.   :-135.00   Length:87695       Min.   :    0.00
##  1st Qu.: -14.45   Class :character   1st Qu.:    0.00
##  Median :  21.75   Mode  :character   Median :    0.00
##  Mean   :  24.27                      Mean   :   69.22
##  3rd Qu.:  81.00                      3rd Qu.:    1.00
## Max. : 178.06 Max. :36188.00| date | province | country | lat | long | type | cases |
|---|---|---|---|---|---|---|
| 2020-01-22 | Anhui | China | 31.8 | 117 | confirmed | 1 |
| 2020-01-23 | Anhui | China | 31.8 | 117 | confirmed | 8 |
| 2020-01-24 | Anhui | China | 31.8 | 117 | confirmed | 6 |
| 2020-01-25 | Anhui | China | 31.8 | 117 | confirmed | 24 |
| 2020-01-26 | Anhui | China | 31.8 | 117 | confirmed | 21 |
| 2020-01-27 | Anhui | China | 31.8 | 117 | confirmed | 10 |
*There are 33 provices coronavirus cases recorded due to type (confirmed, death, recovered) and due to date.
Data Analysis
| type | total_Cases |
|---|---|
| confirmed | 84019 |
| death | 4637 |
| recovered | 80193 |


| province | confirmed_sum | death_sum | recovered_sum |
|---|---|---|---|
| Hubei | 68134 | 4512 | 64564 |
| Guangdong | 1589 | 8 | 1578 |
| Henan | 1276 | 22 | 1254 |
| Zhejiang | 1268 | 1 | 1267 |
| Hong Kong | 1047 | 4 | 992 |
| Hunan | 1019 | 4 | 1015 |
| Anhui | 991 | 6 | 985 |
| Heilongjiang | 945 | 13 | 933 |
| Jiangxi | 937 | 1 | 936 |
| Shandong | 788 | 7 | 777 |
| Shanghai | 660 | 7 | 632 |
| Jiangsu | 653 | 0 | 653 |
| Beijing | 593 | 9 | 573 |
| Chongqing | 579 | 6 | 573 |
| Sichuan | 561 | 3 | 558 |
| Fujian | 356 | 1 | 354 |
| Hebei | 328 | 6 | 321 |
| Shaanxi | 308 | 3 | 297 |
| Guangxi | 254 | 2 | 253 |
| Inner Mongolia | 209 | 1 | 190 |
| Shanxi | 198 | 0 | 199 |
| Tianjin | 191 | 3 | 186 |
| Yunnan | 185 | 2 | 183 |
| Hainan | 168 | 6 | 172 |
| Guizhou | 148 | 2 | 148 |
| Liaoning | 147 | 2 | 144 |
| Gansu | 139 | 2 | 137 |
| Jilin | 133 | 1 | 108 |
| Xinjiang | 76 | 3 | 73 |
| Ningxia | 75 | 0 | 77 |
| Macau | 45 | 0 | 42 |
| Qinghai | 18 | 0 | 18 |
| Tibet | 1 | 0 | 1 |


\[ Infection Fatality Rate (IFR) = \frac{Deaths}{Cases}* 100% \]


According to figures 7- 10, figure 08 shows that, the number of confirmed cases gradually increases during the period from January to mid-February and it gradually decreases during the period from mid-February to March. Shows the maximum confirmed cases during the month of February and it approximately near to 15,000. The number of confirmed cases has been gradually declining since March.
Figure 09 shows that, the number of recovered cases increases rapidly during the period from mid-February to mid-March and decreases rapidly during the period from mid-March to mid-April. Shows maximum during March and from mid-April, the number of recovered cases gradually decreases.
Figure 10 shows that, during the period from February to April the number of death cases shows a gradual increase and decrease. While this is relatively low, there is a sudden increase in the number of death cases in late April and it near to 1,250.
Overall, the number of confirmed cases increases during the period from February to March. As the number of confirmed cases increases, the number of recovered cases increases at a relatively low rate from mid-February to mid-April.
Furthermore figure 11, Table 05 and Figure 12, clearly shows the observations shown above.
| month | type | sum_cases |
|---|---|---|
| 01 | confirmed_sum | 9802 |
| 01 | death_sum | 213 |
| 01 | recovered_sum | 214 |
| 02 | confirmed_sum | 69554 |
| 02 | death_sum | 2624 |
| 02 | recovered_sum | 39120 |
| 03 | confirmed_sum | 2924 |
| 03 | death_sum | 472 |
| 03 | recovered_sum | 36887 |
| 04 | confirmed_sum | 1677 |
| 04 | death_sum | 1328 |
| 04 | recovered_sum | 3272 |
| 05 | confirmed_sum | 62 |
| 05 | death_sum | 0 |
| 05 | recovered_sum | 700 |


| province | confirmed_sum | death_sum | recovered_sum |
|---|---|---|---|
| Anhui | 991 | 6 | 985 |
| Chongqing | 579 | 6 | 573 |
| Henan | 1276 | 22 | 1254 |
| Hubei | 68134 | 4512 | 64564 |
| Hunan | 1019 | 4 | 1015 |


| country | confirmed_sum | death_sum | recovered_sum |
|---|---|---|---|
| US | 1369376 | 82356 | 232733 |
| Spain | 238064 | 26920 | 138980 |
| Russia | 232243 | 2116 | 43512 |
| United Kingdom | 227742 | 32770 | 1367 |
| Italy | 221216 | 30911 | 109040 |
| France | 183088 | 26994 | 57898 |
| Brazil | 178214 | 12461 | 72597 |
| Germany | 173171 | 7769 | 147200 |
| Turkey | 141475 | 3894 | 98889 |
| Iran | 110767 | 6733 | 88357 |
| China | 84019 | 4637 | 80193 |

| country | confirmed_sum | death_sum | recovered_sum |
|---|---|---|---|
| Afghanistan | 4963 | 127 | 610 |
| Bhutan | 11 | 0 | 5 |
| Burma | 180 | 6 | 76 |
| China | 84019 | 4637 | 80193 |
| India | 74292 | 2416 | 24420 |
| Kazakhstan | 5279 | 36 | 2223 |
| Kyrgyzstan | 1037 | 12 | 709 |
| Laos | 19 | 0 | 14 |
| Mongolia | 42 | 0 | 15 |
| Nepal | 217 | 0 | 33 |
| Pakistan | 34336 | 737 | 8820 |
| Russia | 232243 | 2116 | 43512 |
| Tajikistan | 729 | 21 | 0 |
| Vietnam | 288 | 0 | 262 |

Conclusins and Discussion
Main objective in this report is to analyze the coronavirus situation in China. To come across these findings, coronavirus data set was used. The study established that Hubei province had highest coronavirus confirmed, recovery and death cases compared to other counties. Also that total values are really higher than to other provinces. This implies that the steps taken by the Chinese government to spread the virus in China have been successful. This is because as the spread of the virus in Hubei province increased, steps were taken to lockdown those provinces and cities. Because of that in other provinces of China, the number of confirmed cases are very low. Provinces near to Hubei this also proved. Overall, the number of confirmed cases and recovered cases in China is close compared to other countries. From February to May, the virus spreads rapidly from February to March, and patients recover at a relatively slow rate between mid-February and April.
China is the country where the virus originated. But the number of reported cases in China is low compared to other countries. Especially with US. China is also the country with the highest number of cured patients compared to the reported number. Similar situation on when compared with border countries of China. Confirmed cases in China was lower than to Russia. Pakistan, India and Russia recovered cases were relatively lower than to confirmed cases. This shows that the actions taken by the Chinese government to control the virus have been successful. Also that some other countries have not taken appropriate actions or there has been a delay in taking actions.
In the coronavirus data set there are some negative values in cases column and it was a bit problematic. According to this data set cases values cannot be negative and when calculations are done with negative values, the final results can vary considerably. Therefore, calculations were made regardless of those negative values. More accurate results could not be expected, but relatively accurate results were obtained than before. It is my opinion that this will not make a significant difference to the end result. Analysis of the spread of the virus in China showed that nearly 69,000 patients were reported in Hubei province alone, where the coronavirus is thought to have originated, but the total number of patients in all other provinces is less than 2,000. This made it difficult to obtain clear graphs of data representation in China. The same problem was seen in figures 03, 04, 05, and 13. Therefore in those cases, had to take the log values of cases. Hope that this analysis, which avoids such problems, will be helpful in gaining an understanding of the coronavirus status in China.References
[1] Kaisha Langton. May 30, 2020. China lockdown: How long was China on lockdown?. Available from: (https://www.express.co.uk/travel/articles/1257717/china-lockdown-how-long-was-china-lockdown-timeframe-wuhan )
[2] Nicole Wetsman. July 07, 2020. Everything you need to know about the coronavirus, THE WERGE. ( https://www.theverge.com/ )
[3] Yu x, Li N. May 14, 2020. How Did Chinese Government Implement Unconventional Measures Against COVID-19 Pneumonia. Dovepress. 2020:13 Pages 491—499. DOI :https://doi.org/10.2147/RMHP.S251351
[4] Yueling Ma, Yadong Zhao, Jiangtao Liu, Xiaotao He, Bo Wang, Shihua Fu, Jun Yan, Jingping Niu, Ji Zhou and Bin Luo. July 01, 2020. Effects of temperature variation and humidity on the death of COVID-19 in Wuhan, China. Science of The Total Environment : 724. DOI: https://doi.org/10.1016/j.scitotenv.2020.138226